In previous posts, we outlined how to use the financial statements of a water or wastewater system to calculate the key financial indicators of operating ratio (a measure of self-sufficiency) and debt service coverage ratio (a measure of a system’s ability to pay its long-term debts). Another key financial indicator is days of cash on hand.
Days of cash on hand is a measure of a system’s financial security. In essence, this is how much cash a system has saved up that isn’t earmarked for anything else (unrestricted cash) and estimates the number of days the system can pay its daily operation and maintenances costs before running out of this cash. This is obviously a worst-case scenario—it estimates how long a system can run if it receives no additional revenue, but it is a helpful measure of how long a system can operate if it has a sudden and dramatic reduction in operating income, perhaps from a large customer leaving or from mandatory restrictions due to drought conditions.
As we have stated before, key financial indicators are a way for a system to get a snapshot of its financial health and to determine whether it needs to make adjustments to its rates, and they should be calculated annually when financial statements are released.
Days of cash on hand is calculated by dividing unrestricted cash and cash equivalents by the system’s average daily cost of operations, excluding depreciation (annual operating expenses, excluding depreciation, divided by 365). If the system is owned by a government that follows GASB 34 procedures for audited financial statements, the unrestricted cash and cash equivalents can be found on the Statement of Net Assets for the proprietary fund, whilst the annual operating expense and depreciation numbers can be found on the Statement of Revenues, Expenses, and Changes in Fund Net Position for the proprietary fund.
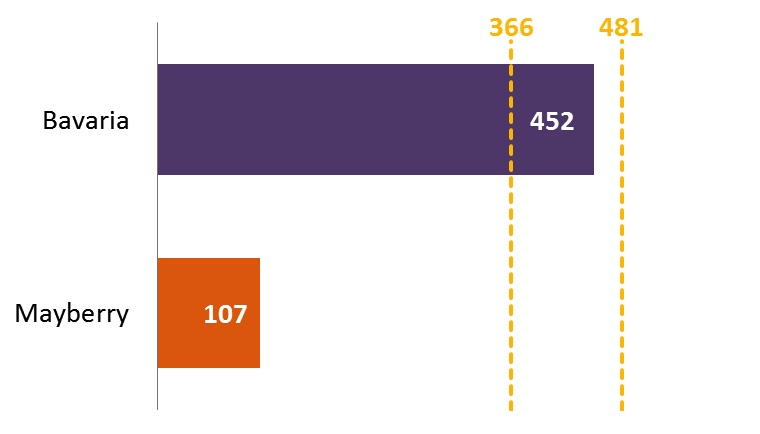
There are no natural, objective targets for systems to aim for. The higher the number, the more protected the system will be against revenue shocks, but the target value is subjective. Generally, a system should aim to maintain several months’ worth of cash on hand and at the very least exceed the length of the billing period (usually 30 or 60 days). In 2015, the median days of cash on hand for A-rated water and sewer systems by Fitch Ratings was 366. So, for half of those systems, if they completely stopped making money, they could afford to operate and maintain their system for one year. The median for AAA-rated water and sewer systems in 2015 was 481.
It should be noted that certain numbers on financial statements, such as operating expenses and depreciation, represent annual totals. It is not possible, obviously, to show an annual total or even an annual daily average of unrestricted cash. Rather, the number on financial statements represents the amount of unrestricted cash available to the system on the day the financial statements were prepared. That day may or may not have been representative. Perhaps the system just received a large influx of checks from customers to cover monthly bills, so the number could be higher than average. Conversely, it is possible that payments from customers are still a few days away, and perhaps a large expense like an energy bill has just been paid, so the number could be lower than average. Staff who work regularly with system financials should be consulted to understand whether the reported unrestricted cash number is close to typical.
In our workshops on rate setting and fiscal planning for small water systems, we often include a session on how to measure key financial indicators like days of cash on hand by showing two example water systems—Bavaria and Mayberry. These are two similarly sized water systems from the same state (the names have been changed, but the numbers are real). Each serves about 1,500 customers, and each community has a median household income of about $30,000 with about 25 percent of residents living below the poverty line. On paper, these two systems look identical, but their days of cash on hand tell a very different story.
In our example, Bavaria has about $568,000 in unrestricted cash available, with operating expenses (excluding depreciation) of about $460,000, giving it about 452 days of cash on hand. In Mayberry, the unrestricted cash available is about $108,000, with annual operating expenses (without depreciation) of approximately $369,000, giving it about 107 days of cash on hand.
Bavaria’s level exceeds the median for A-rated water and wastewater systems. If they received no additional revenue, they could operate their system for well over a year. Mayberry’s number is significantly lower. Nevertheless, without additional revenue, Mayberry could operate for more than three months.
Is three months enough? Is 15 months enough? That is up to the individual water and wastewater systems to determine, and a rate increase can help increase days of cash on hand. Taken with other financial ratios, days of cash on hand can help systems understand their financial decision as they make choices about their rates for the coming year.
