

The Environmental Finance Center currently produces statewide water and wastewater rates dashboards for 12 states across the US. We collect a lot of data on water system finance and management to build these dashboards, and those data can tell interesting stories about how water and wastewater systems structure their rates. This post presents key features of rate structures across seven states where we have survey data available: Alabama, Arizona, Georgia, Illinois, North Carolina, and Wisconsin.
Types of Rate Structures
The vast majority of systems in those seven states have rate structures that we classify as “Uniform,” “Increasing Block,” or “Decreasing Block.” Uniform rates charge the same price for every 1,000 gallons of water. Increasing Block structures, also called Inclining Block, are rate structures where the system charges a higher price at larger volumes of water. For example, a system might charge $4.00 per 1,000 gallons for the first 5,000 gallons, and $8.00 per thousand gallons for all subsequent usage. Decreasing Block structures, also called Declining Block, operate on the same principle, but in reverse. In these structures, the price of water per 1,000 gallons decreases at larger volumes of water.
About 3 percent of systems in our surveys have a rate structure that does not fit into one of these categories, which we have labeled as “Other.” These include
- Increasing/decreasing block—rates increase over an initial range and decrease over subsequent ranges or vice versa;
- Flat Fee—one price per billing period for unlimited water consumption;
- Tiered Flat Fee—one price per billing period for unlimited water consumption that varies by customer class;
- Seasonal uniform—uniform rates that vary by season; and
- Uniform at One Block’s Rate—customer pays one rate per 1,000 gallons, but that rate is determined by their total usage.
Prevalence of Different Rate Structures
The chart below shows the rate structures for 2,786 water systems across the seven states. Uniform rates are most common, but many systems have increasing or decreasing block rate structures.
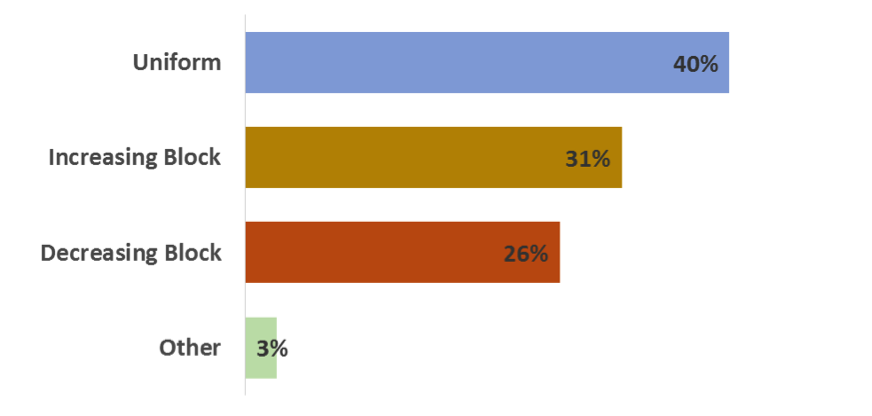
Analysis by Environmental Finance Center @ UNC. Data gathered from 7 surveys over a 4 year time period 2013-2016. N = 2,786 systems.
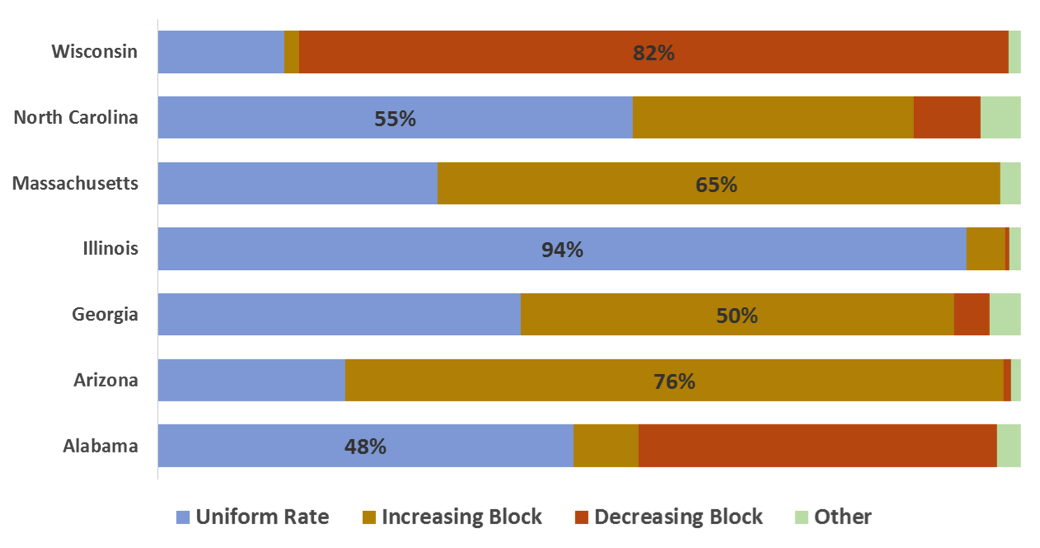
We do see variations in the patterns of rate structures by state. For example, increasing block rates were most likely to be found in Arizona, Georgia, and North Carolina, while almost all systems in Illinois had uniform rate structures. About 92% of the decreasing block structures were in Wisconsin or Alabama. Below is a table showing the state-by-state breakdown. The labels on the bars indicate what percentage of the systems in a state have the most common rate structure for that state. For example, 82% of systems in Wisconsin have a decreasing block structure.
Effective Rate Structures for Residential Customers
Some systems that have increasing or decreasing block structures set the first block high enough that almost no residential customers reach it. The goal of these structures is usually to have a block structure that targets commercial or industrial customers, not residential customers. In effect, residential customers at these systems are paying uniform rates. The chart below shows the effective rate structures that would actually apply to most residential customers. If a system’s first block is larger than 15,000 gallons, then it is classified as “uniform” in the chart.
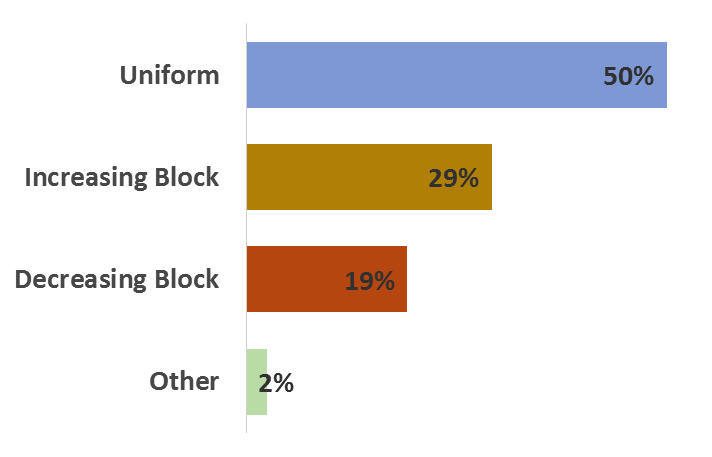
Analysis by Environmental Finance Center @ UNC. Data gathered from 7 surveys over a 4 year time period 2013-2016. N = 2,786 systems.
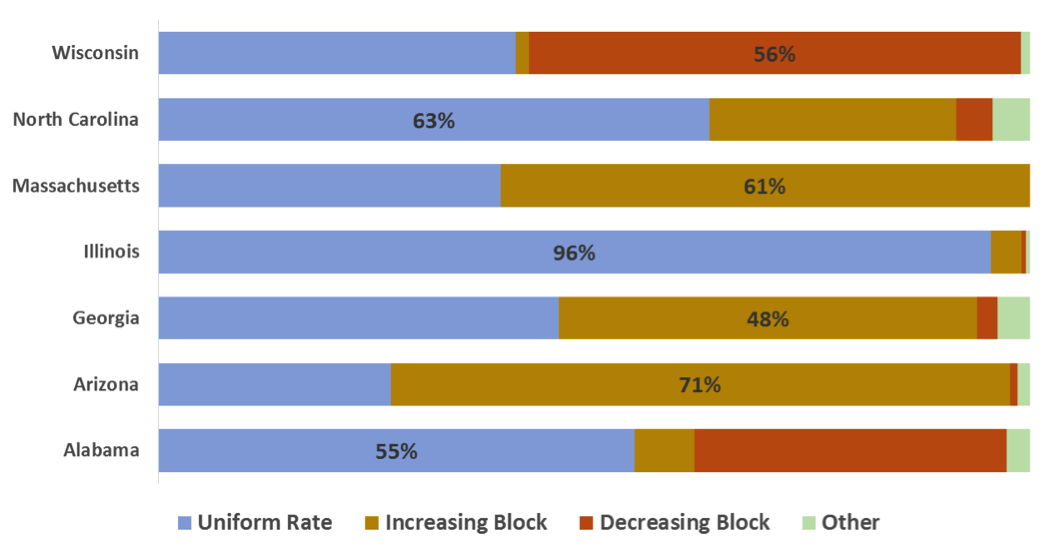
This adjustment caused a slight decrease in the number of increasing block structures but a fairly substantial decrease in the number of decreasing block structures. In total, 63 increasing block structures (7%) and 198 decreasing block structures (27%) were reclassified as uniform block. An implication of these changes is that increasing block structures are more likely to have smaller blocks—and are thus more likely to be targeted at residential customers—while decreasing block structures are more likely to have large blocks—and thus more likely to be targeted to non-residential customers. Wisconsin had the most significant re-categorization, as can be seen in the chart below. While 82% of Wisconsin systems had nominal decreasing block rates, only 56% of them have effective decreasing block rates. However, it is still the most common rate structure in the state.
Variations in Rate Structures by System Size
How do rate structures vary by system size? As the chart below shows, large systems (population over 10,000) and small systems (population under 10,000) were essentially equally as likely to have uniform rate structures (in this case “uniform” only includes those systems that report their rate structure as such, not systems that have been adjusted). However, large systems were much more likely to have increasing block structures, while small systems were much more likely to have a decreasing block structure.
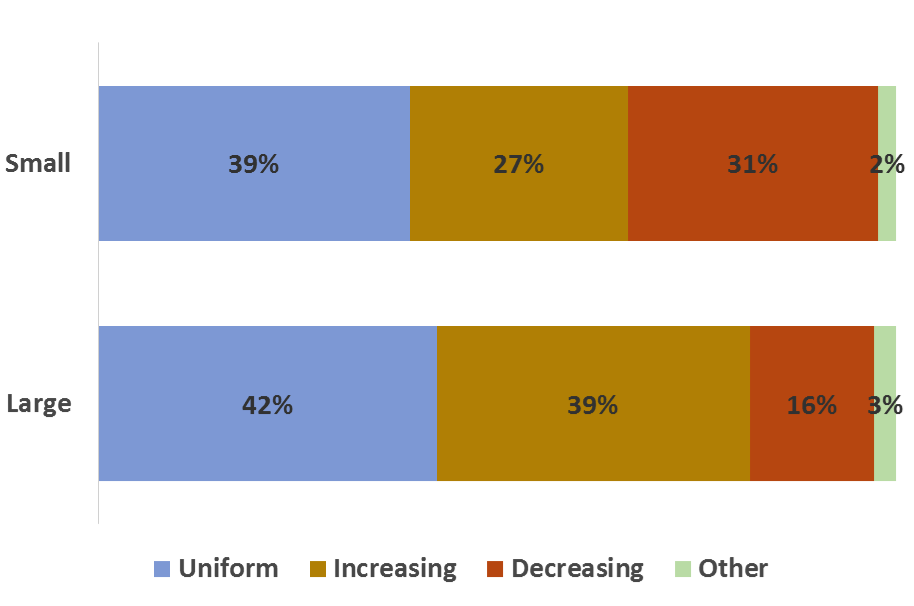
Analysis by Environmental Finance Center @ UNC. Data gathered from 7 surveys over a 4 year time period 2013-2016. N = 2,638.
One particularly striking fact is that out of 58 very large systems (population over 100,000), 40 had increasing block structures, and only 2 had decreasing block structures. The effective rate structure by system size has a similar breakdown.
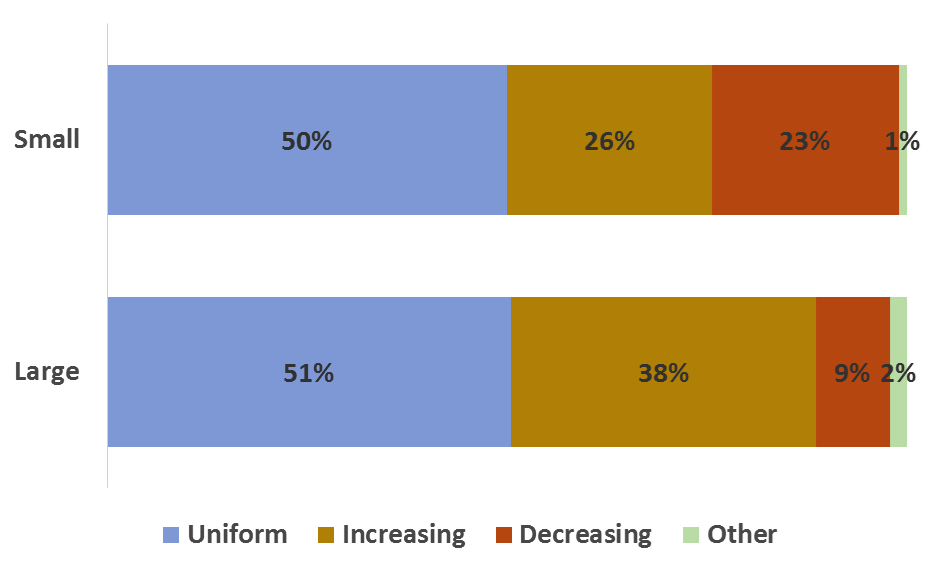
The proportion of systems with uniform rate structures increases slightly more for small systems than large systems. Interestingly, both Very Large systems with decreasing block rates have effective uniform rates, while none of the Very Large systems with increasing block rates have effective uniform rates.
In future posts, we will explore more data summaries including average monthly bills, base charges, and billing periods. Please leave a comment with any other analysis that you would like to see.