
According to data collected and published by the Congressional Budget Office (CBO), federal, state, and local governments in the United States spent more than $2.2 trillion in the last 59 years on operations, maintenance, and capital infrastructure of water and wastewater utilities. That equates to more than $4,131,000,000,000 in 2014 dollars, adjusting for inflation of infrastructure-specific costs. Following our earlier blog post demonstrating that federal spending on water and wastewater utilities decreased since the 1980s, we analyzed the data and identified 4 more trends in how government spending on utilities changed between 1956 and 2014.
Data on government spending
In March 2015, CBO published a report on the annual government expenditures on infrastructure, titled Public Spending on Transportation and Water Infrastructure, 1956 to 2014. CBO collected data on federal expenditures from the Office of Management and Budget (OMB) and data on state and local government expenditures from the Census Bureau (private investment was not included, focusing entirely on public spending). CBO published the data in a file supplementing the report. Expenditures data were displayed for seven categories of infrastructure, including one for water and wastewater utilities described as expenditures on “supply systems for distributing potable water as well as wastewater and sewage treatment systems and plants.” This category excludes expenditures on water resources (dams, reservoirs, watersheds, water sources) and water transportation, which are two separate categories. CBO further split expenditures by type of government (federal versus state and local government), category of expenditures (capital versus operation and maintenance), and by federal fiscal years. All expenditures were inflated to 2014 dollars, using price indices related to infrastructure-specific costs.
For this blog post, we analyzed the data specific to public spending on water and wastewater utilities, always using the 2014-inflated dollars to reveal the following four trends in real spending between 1956 and 2014:
1. Government spending on water and wastewater utilities grew nearly every year (but declined recently)
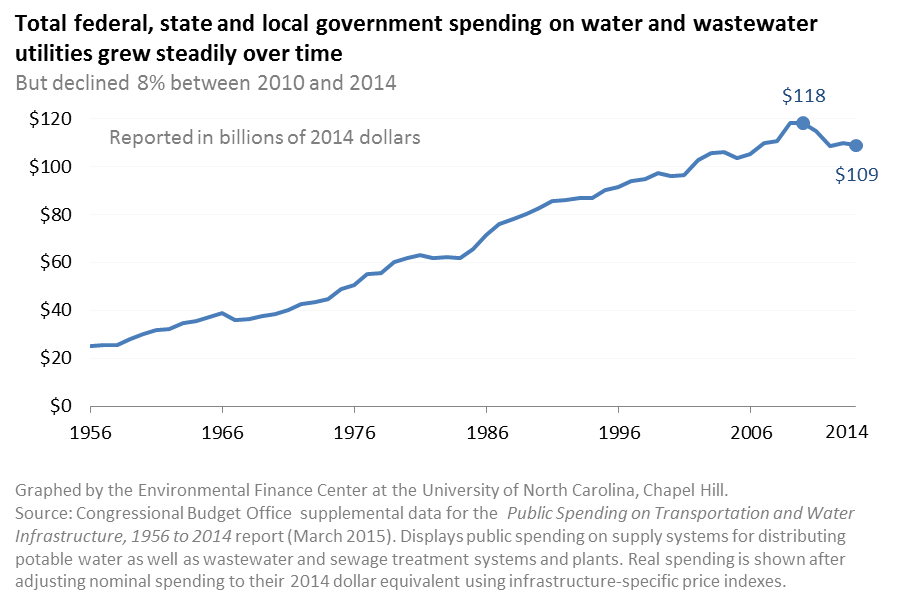
In real dollars, total government spending – including federal, state, and local government – on capital and operations and maintenance of the utilities grew on average 3%-4% per year through the 1980s, and then at about 1%-2%/year since the 1990s. The steady increase was likely influenced by a growing number of utilities across the country, increasing regulations, and rising costs for labor and materials, among other factors.
Total public spending peaked in 2010 and decreased by 8% between 2010 and 2014. This is the most significant four-year decline in real expenditures since 1956. The main reason for this late decline has been a significant decrease in capital expenditures, particularly among state and local governments.
2. The increase in public spending was largely paid for by state and local governments, which now pay significantly more than the federal government
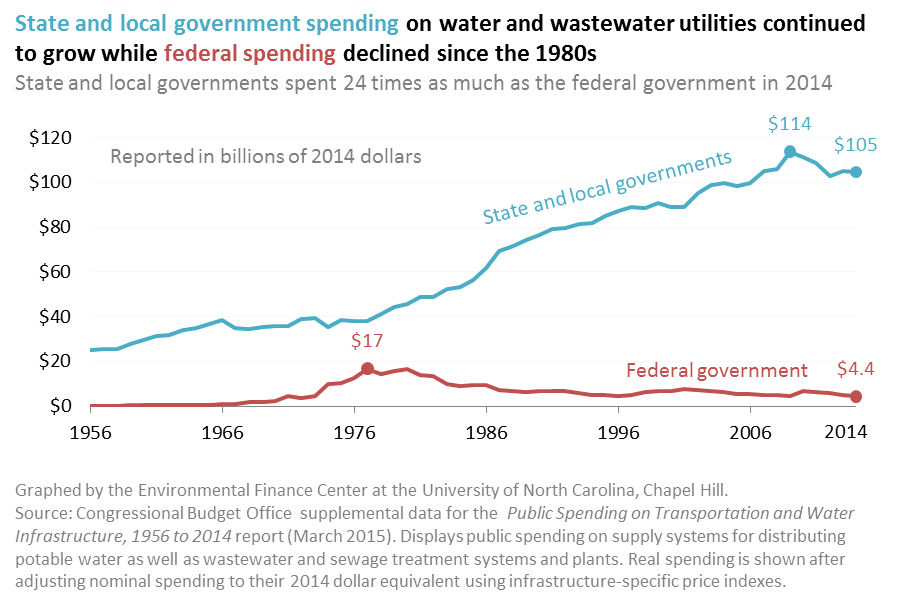
For a period of 10-15 years in the 1970s and 1980s, the federal government provided substantial amounts of subsidized funding (largely in the form of grants) to water and wastewater utilities across the country. Since the mid-1980s, the federal government reduced subsidized funding and switched from providing mostly grants to providing mostly subsidized loans. While the federal funding programs have been maintained at relatively steady levels in nominal dollars, the real purchase power of these programs has diminished over time.
In contrast, state and local governments have increased real spending on water and wastewater utilities nearly every year until 2009. This may have occurred as local and state governments took on the costs that were no longer being funded by the federal government, or perhaps because more utilities were now in operation (or expanded) as a result of the federal government spending a few years earlier, or both. The gap between state and local government spending and federal government spending on the utility sector widened over time; by 2014, state and local governments accounted for 96% of all public spending on water and wastewater utilities. Although CBO did not differentiate between state spending and local government spending, it is likely that the majority of the state and local government spending nationally was actually spent by local governments.
3. Operations and maintenance expenditures are higher (and growing faster) than capital expenditures
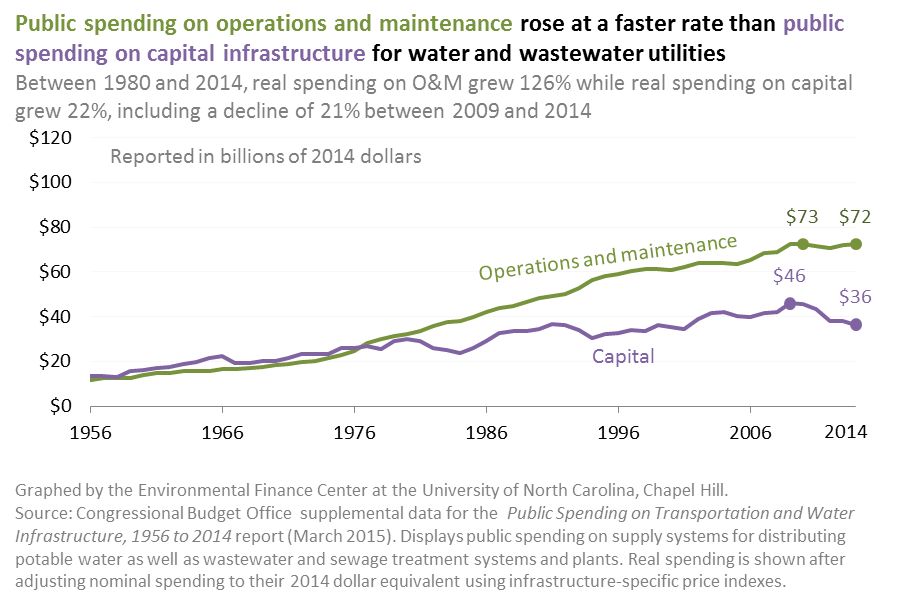
For several years until 1980, public spending was split almost evenly between capital expenditures (to build or replace water and wastewater systems) and operations and maintenance of the systems. Since then, however, O&M spending continued to grow at 4%-6%/year to the mid-1990s, and afterward at 1%-3%/year. Between the years 2009 and 2014, real spending in O&M remained steady at about $72 billion/year in 2014 dollars. By comparison, capital spending grew at about 1%-2%/year since 1980 and declined by an average of 4%/year since 2009. Currently, governments spend twice as much on operations and maintenance of their existing systems than on capital expenditures to rehabilitate, replace or expand existing assets or install new infrastructure.
Nearly all of the O&M expenditures are borne by state and local governments, which also account for 91% of all capital expenditures in 2014. As state and local governments’ budgets are spread thinner by paying for rising operations and maintenance, their ability to also pay for capital expenses decreases.
4. State and local governments are increasingly picking up the tab for capital expenditures (but reduced sharply in recent years)
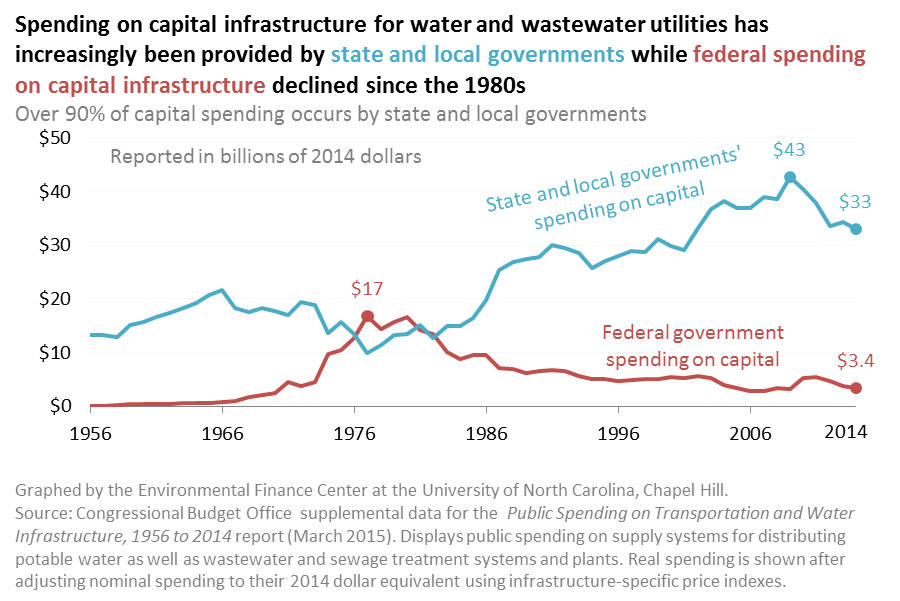
Focusing only on capital expenditures reveals the inverse relationship between federal capital spending and state and local government capital spending. As the federal programs increased capital funding for utilities, state and local governments spent less of their own money on capital projects. For four years, the federal government outspent all of the state and local governments combined on capital projects for water and wastewater utilities. Since the mid-1980s, though, as the federal funding programs decreased, state and local governments increased their capital spending significantly for a few years and then on average at 1%-3%/year until 2009. Between 2009 and 2014, state and local governments decreased capital spending by 22%; at the same time, federal capital spending did not change significantly.
By and large, the onus of public funding for water and wastewater capital projects has been on state and local governments for the past couple of decades. In 2014, even after five years of decline, state and local governments still accounted for more than 90% of all public spending on capital projects. The recent decrease in local and state government capital expenditures may thus be of particular concern if it continues for a few more years. Capital needs to rehabilitate or replace aging infrastructure for water and wastewater utilities have been estimated in the hundreds of billions of dollars (even more than a trillion dollars to maintain government-owned and investor-owned water utilities’ pipes and buried assets at the current level of service and expand water service to growing populations in the next 25 years, not counting the wastewater capital needs). If state and local governments’ budgets are increasingly being devoted to covering operations and maintenance costs, it will be difficult for these governments to spend such large sums on capital expenditures in the future without some help, either in the form of federal spending and/or private sector investment in the infrastructure. If the current total public spending of $36.4 billion on capital is maintained annually, it would take 28 years to fund $1 trillion of infrastructure costs for government-owned utilities – it is difficult to tell whether that is sufficient to fund the public sector’s total water and wastewater needs to maintain current levels of service and provide for growth and new regulations in those years.
What does this mean for the future?
Analyzing the historic trends of public spending is insightful, but cannot accurately project what will happen in the future, especially without information on private sector investments. We have demonstrated with the CBO published data how much state and local governments have been and are currently investing in water and wastewater utilities, with some help from the federal funding programs. The recent data also show that it will be difficult to fund the sector’s capital needs along with growing operations and maintenance costs on current trends alone. However, there have already been some changes in priorities and programs in recent years.WRRDA created the new Water Infrastructure Finance and Innovation Authority and updated the Clean Water State Revolving Fund program, providing new avenues to fund water and wastewater utilities. Private-public partnerships are also gaining traction (read about the EFC’s partnership with EPA’s new Water Infrastructure and Resiliency Finance Center to study P3 models for the water sector). These shifts in federal public spending and increasing private sector investment may help alleviate some of the pressure on state and local governments in the long run. In the next few years, though, it is likely that state and, especially, local governments will continue to foot the majority of the bill for government-owned water and wastewater utilities.
Links
Using an Index to Help Project Capital Costs Into the Future
WRRDA: New and Improved Funding for Water Infrastructure
WRRDA: Creating Interactions between the New WIFIA Program and the Updated Clean Water State Revolving Fund