
These are unprecedented times. As the COVID-19 pandemic continues, social norms have changed and unemployment has risen sharply across the nation. As states have pushed residents to stay home, water usage patterns have altered for both commercial and residential customers. In many cases, commercial customers have decreased use while residential customers have increased. Schools have been closed for months, some of which are the largest water customers in a small town or county. Executive orders have been passed, mandating that service cannot be cut-off for non-payment.
In short, revenues have changed. The level of change varies based on the makeup of the utility’s customer base and the specific hardships within the area, but the change exists in every case. These changes in revenues are typically associated with losses, meaning that budget predictions are off and the actual revenue collected will be much lower than planned.
Utilities will need time to recover these losses. But how do we measure a utility’s ability to bounce back? Bring in the buzz word: Resilience.
At the EFC, we see this pandemic as both very different than anything the US has ever experienced, and also very similar to some of the short-term shocks experienced by utilities in past emergencies. For example, a drinking water utility serving a coastal community that has been walloped by a hurricane. In both cases, utilities that are more financially resilient are more likely to bounce back faster.
How can a utility be “financially resilient?”
In short, it depends. In the pandemic and hurricane examples, financial resilience often equates to having cash on hand to smooth out sudden revenue shocks. Being financially resilient often requires a “gut check” of what level of risk a utility is comfortable with. A more risk-averse utility with a greater likelihood of a major shock (like a storm or having a large portion of revenues tied up in a single, large customer) may tend to keep more cash on hand.
In cases of storms, utilities often report using the fund balance to cover any loss in revenue or increase in costs due to damages. In the case of the COVID-19 pandemic, the EFC estimates the same will be true. Costs are unlikely to increase, but—given protocols to protect employees and other unpredictable changes—it could happen. In either case, having a strong fund balance can help “weather the storm,” regardless of the type of “storm.”
There are other examples of setting aside money, like creating an emergency fund or something similar, but the sentiment remains the same: having liquid assets (unrestricted cash) to fill the gap. Think of it like spackling a hole in the wall; the spackle is the fund balance, the hole is the revenue loss.
Assessing Financial Resilience
Only the individual utility knows the “right size” of their reserves and fund balance. But to help utilities understand how their cash on hand can supplement revenue losses, the EFC created an easy-to-use Tableau tool.
There are two versions of the tool, one with financial data pre-populated (states with Water and Wastewater Rates Dashboards and the associated financial data) and one with areas to input the necessary financial information. This blog post will walk through the version without any data pre-populated.
What data to I need?
To complete the tool, the utility representative needs to know the utility’s:
- Operating Revenues
- Operating Expenses
- Unrestricted Cash (Also known as Cash and Cash Equivalents)
- An estimate of revenue losses
What does the tool tell me?
The tool takes a common financial indicator, days cash on hand, and turns it around. Rather than telling you how long you could cover day-to-day operating expenses without any revenue coming in, the tool tells you how long the utility could use cash to “spackle the hole” in revenue. It is just an estimation, and cautions users to understand that cash and cash equivalents often have other uses within the utility budget, like addressing emergencies within the system. The “number of days” is based on the idea that all cash and cash equivalents would be used to supplement revenue loss. It is thus an overestimation.
It is also built on an estimate of revenue losses. In some cases, utilities may not yet know what those revenue losses will look like. Luckily, the EFC has been working on a tool for that, too. For more information on the Revenue Loss Tool or to request direct assistance, click here.
Back to the Tableau tool. How about some screenshots?
Sure thing! Here is the second page of the tool. It is likely the most important one, as it includes both the inputs and the results.
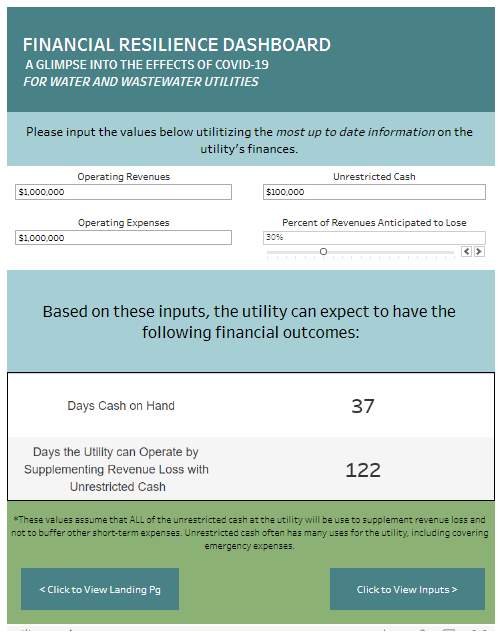
Financial Resilience Dashboard inputs and results (page two)
What does it all mean?
A number without a benchmark is just a number. The problem is that the benchmark is very utility-specific and depends on the composition of the customer base as well as the susceptibility of the customer base to economic shocks, like a rise in unemployment.
Having conversations at the utility about the level of risk tolerance is a good start. Talk to other utilities. Have an open forum.
To better understand potential revenue losses and the resilience of an individual utility’s finances in greater detail, reach out to anyone at the EFC, or request assistance at this link. To learn more about Local Government Finance and Resilience, check out this blog by Liz Harvell at the EFC.
Austin Thompson joined the EFC at UNC in 2018 as a Project Director. In this role, she conducts applied research and provides technical assistance and training for environmental service providers. Thompson holds a BS in Biological Sciences from the University of South Carolina and a Master’s of Environmental Management from Duke University, with a concentration in Environmental Economics and Policy.
Links
Utility Financial Sustainability Tools and Rates Dashboards
Financial Resilience Dashboard: A Glimpse Into The Effects Of COVID-19 For Water And Wastewater Utilities
Key Financial Indicators for Water and Wastewater Systems: Days of Cash on Hand
Local Government Financial Resilience and Preparation Before a Natural Disaster