
Similar to the roughly quarter of Americans living paycheck to paycheck, many water and wastewater systems operate without a safety net, using virtually all of its monthly revenue obtained from customer rates and fees to pay for that month’s expenses. If an emergency happens, such a system can experience significant financial hardship caused by sudden expenses or losses in revenue.
If you are running a drinking water or wastewater utility, it can be hard to know the status of your finances. Are your finances in good condition, only okay, or in poor shape? Doing a finance wellness check can help you evaluate your financial outlook, implement changes to address looming issues and put your system in a better position to weather tomorrow’s fiscal challenges.
The Environmental Finance Center Network encourages all utilities to periodically review their finances, with an annual (or more frequent) review considered best practice. The review should evaluate financial metrics to give an overall picture of the system’s finances. No one metric is going to tell the story of the utility; several metrics should be evaluated and the results taken as a whole to determine the overall financial picture. The Southwest Environmental Finance Center has a tool available—The Water Utility Financial Analysis Tool or WUFA—to help you with the evaluation.
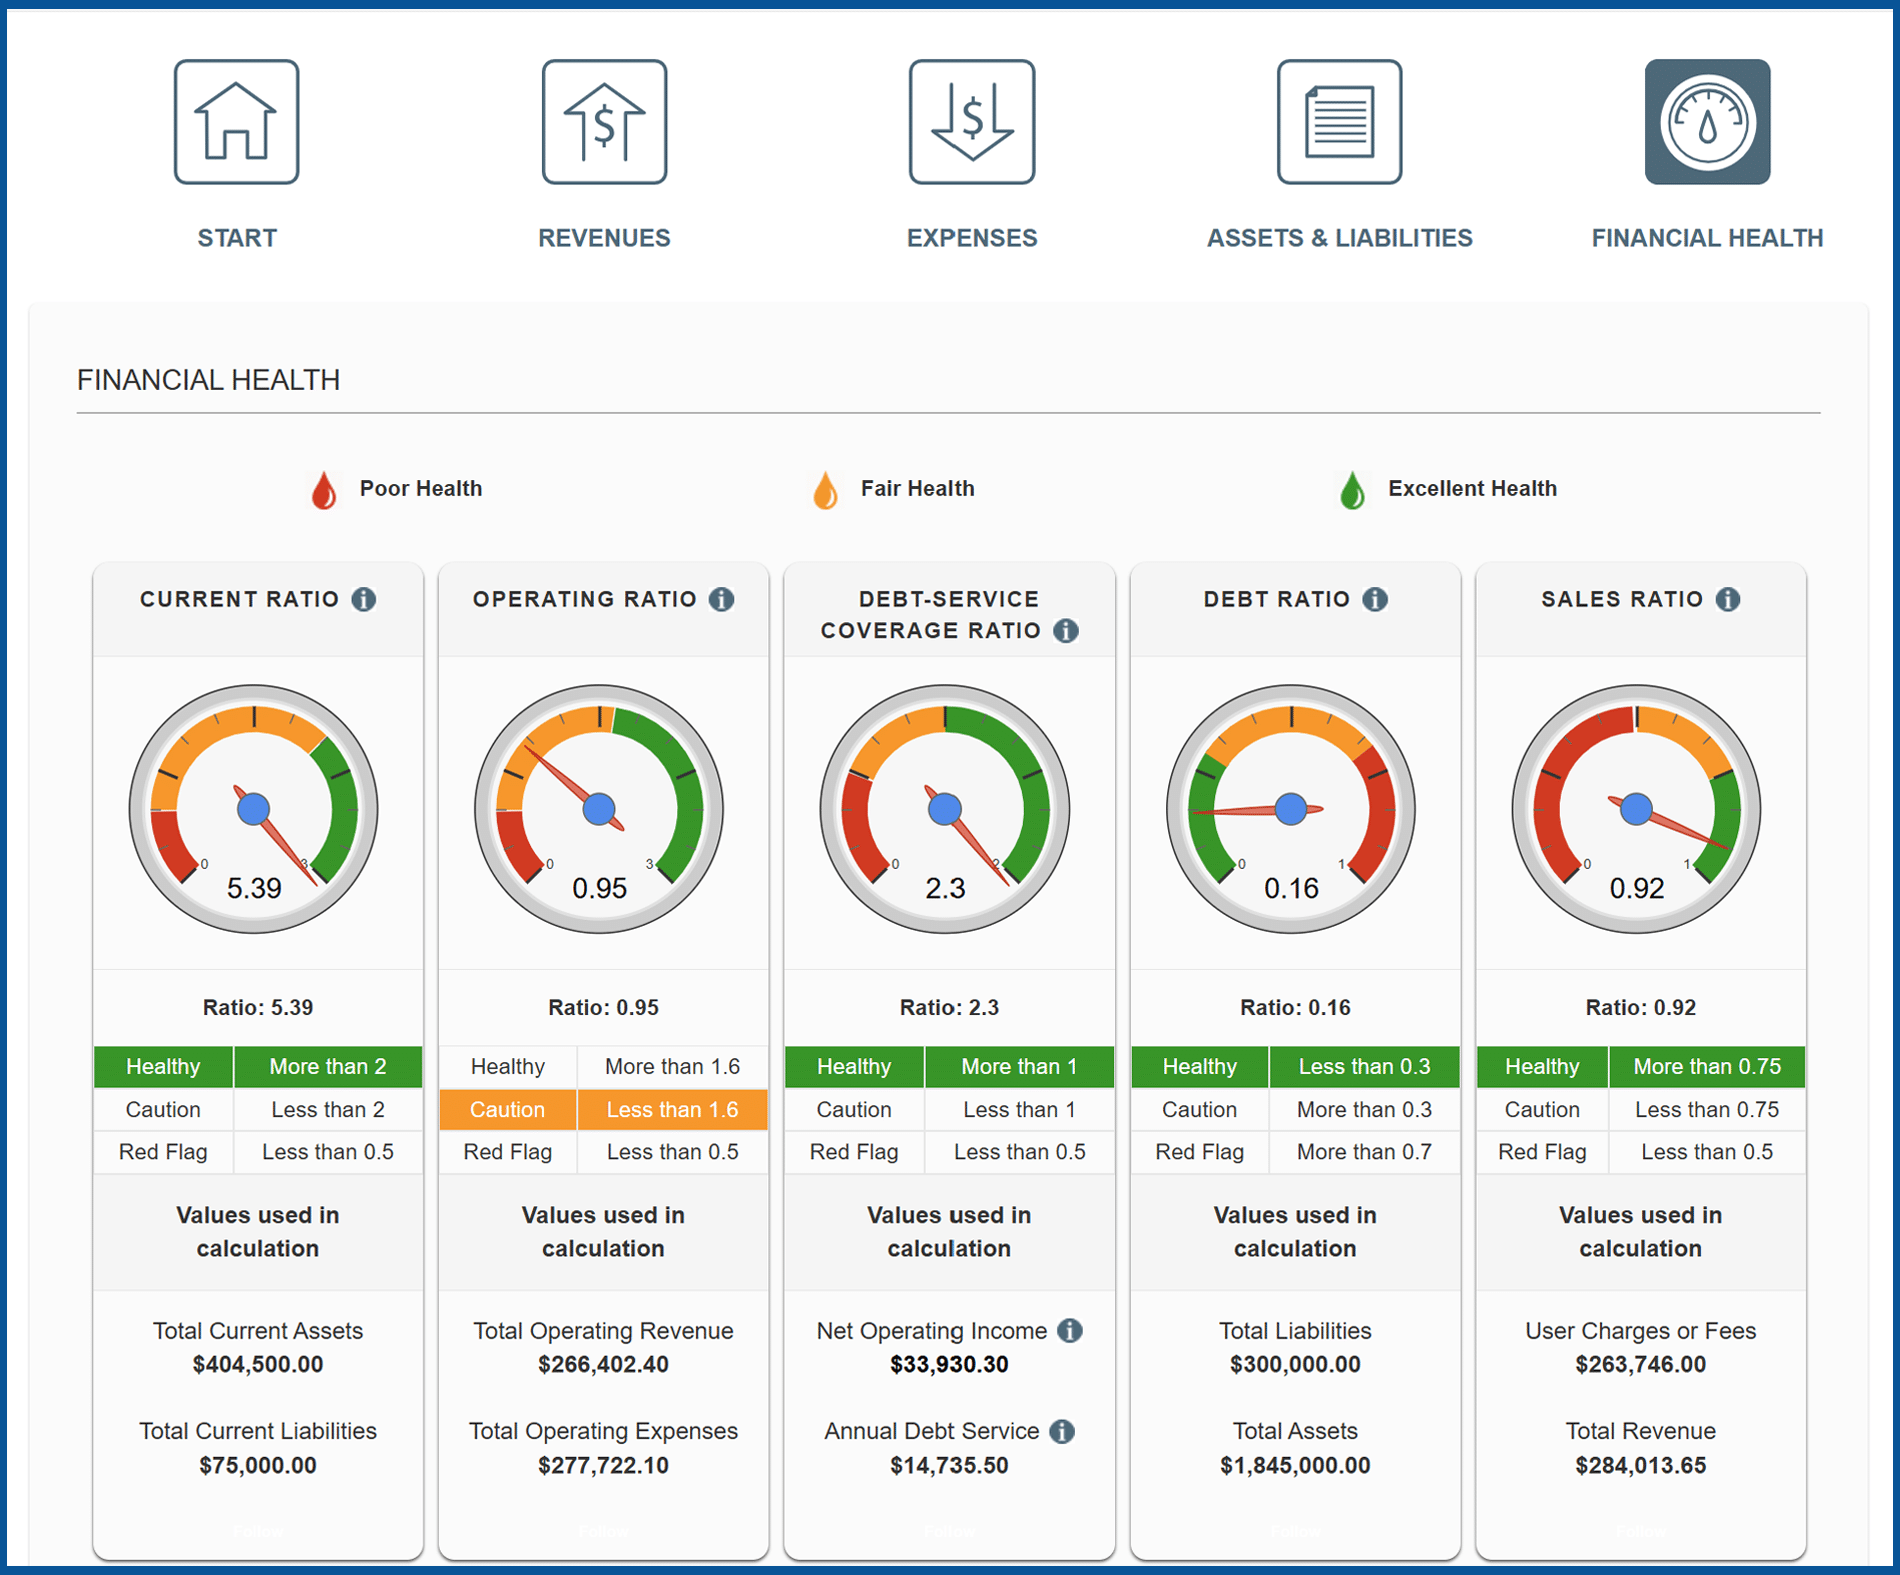
To use the tool, a utility needs to enter their financial information into the various entry screens as described in the tool. Several different ratios are calculated using the data that is entered and the final screen with the metrics includes a dial to show the financial condition for each ratio. Readings in the green portion of dials indicate a system’s finances are in good shape based on the metric, while a yellow reading indicates caution and a red reading concern for the financial condition. The dials are set for standard evaluations and individual systems or states may choose to consider slightly different ranges for the green/yellow/red zones for the metrics. (The SW EFC does NOT save any utility data, so the results are just for the system itself.) The financial ratios included in the tool are discussed below.
Current Ratio
A current ratio measures the system’s ability to cover current liabilities based on its assets. A current ratio of 1 means that the utility has just enough current assets to cover its current liabilities, while a ratio of 2 or greater is considered healthy, meaning that the utility has twice the current assets needed to cover current liabilities. To qualify for financing, some institutions require current ratios higher than 2 for utilities. A ratio less than 0.5 is a red flag for utilities and means the utility should take action to improve its ratio.
Operating Ratio
Arguably the simplest evaluation of a water or wastewater system’s finance is a determination of the utility’s operating ratio, which is a comparison of the operating revenues with the operating expenses. Utilities should always strive to earn more revenue than what it costs to provide services, so an operating revenue above 1.0 is arguably the minimum threshold for a utility to fulfill. The ratio should be set higher (1.6 is a measure of a healthy utility) so that a community can prioritize savings for future expenses or if it needs to pay for other additional costs that are not considered operational, such as loans or depreciation of assets.
To determine an operating ratio, a utility is encouraged to review at least twelve prior months of revenue and expenses, totaling both the accumulated income generated as well as outgoing costs. Looking at a larger time period or multiple years of data allows a system to gauge trends in their ratio, as well as evaluate if the system is fully addressing the financial implications of repair and replacement of its assets over time.
Operating Ratio, Including Depreciation
If a wastewater or water system wishes to more fully encapsulate the costs of running its system, acknowledgment of asset depreciation is highly encouraged. All working components in a utility (pipes, valves, tanks, pumps, clarifiers, etc.) will deteriorate over time. As a result, every utility component depreciates, or diminishes in value, as it ages. Even with exceptional maintenance, eventually an asset will need to be replaced, which will cost the utility money.
Incorporation of replacement costs of assets, through funding of depreciation, is a best practice. By evaluating the rate of depreciation for assets over time and including that in an operating ratio, utilities can better understand if they are saving enough money for both today’s expenses and tomorrow’s replacement of system assets.
Note: this ratio is not calculated as part of the WUFA tool, but a utility can calculate this ratio on its own with the following equation: Total Operating Revenue/(Operating Expenses + Annual Depreciation Expense). The WUFA tool will show the total operating revenue number and the total operating expense number under the Operating Ratio dial so the only number that must be determined is the annual depreciation to calculate this metric.
Debt Service Coverage Ratio
For water and wastewater utilities with loans, understanding the utility’s debt service coverage ratio can help the system evaluate if they are able to take on additional loans or if they should instead prioritize increasing revenue and lowering expenses. This metric measures the cash flow needed to pay current debts, and a ratio greater than 1 is considered healthy.
Debt Ratio
The debt ratio is a measure of the proportion of assets that are financed by debt. In this case, unlike most other metrics, a lower number is better. A ratio of 0.3 or less is considered healthy. A ratio of greater than 1 is a major concern, indicating that the system has more liabilities than assets. This essentially means that the system’s debts could not be satisfied even if all assets were completely liquidated.
Sales Ratio
This ratio measures the amount of revenue generated by a water system that comes from user charges. If a system is continually needing outside sources of funding (funding not coming from the sale of water or wastewater services), it may be a sign of inadequate rates. Ratios greater than 0.75 are considered healthy, while a ratio of 1 would indicate all revenue comes from user fees alone.
Days Cash on Hand
Knowledge of the system’s days cash on hand, or how much money is required to run the utility if revenue ceases, is helpful in assessing whether the system has sufficient savings to address an emergency. The more days cash on hand, the longer the system can sustain itself during an emergency where revenues may decrease or expenses increase. A utility should have, at a bare minimum, enough days cash on hand to cover its billing period (e.g., monthly, quarterly, annually). It is healthier to have a longer cash on hand period and some utilities maintain a year’s worth for better stability. This ratio is not included in the WUFA tool, but can be calculated with the following formula: (unrestricted cash and cash equivalents X 365)/(Total Operating Expense – Depreciation).
Conclusion
Whether or not you currently have concerns about your wastewater or drinking water system’s financial viability—, internal and external evaluations of your financial health can give you peace of mind, help you prioritize next steps in financial planning, and ultimately ensure you can steward your utility sustainably into the years ahead. The Environmental Finance Center Network offers a free financial health checkup tool, the WUFA tool, webinars to show how to incorporate these components, and free technical assistance to small water and wastewater systems to build internal capacity to do these evaluations.
Read the following blog, Improving Your System’s Financial Health, to learn more about how to adjust your rate structure to meet revenue needs.