
Texas, the Lone Star State, is the second-largest state in the union, and the second-most populous. That means a lot of thirsty Texans when those hot summers roll around! As such, Texas has a great many water and wastewater utilities to serve the needs of its residents. Drawing on rates data from the Texas Municipal League, finance data from the Texas Water Development Board, and affordability and economic data from the U.S. Census Bureau and U.S. Bureau of Labor Statistics, and with funding assistance from the U.S. Environmental Protection Agency and the Water Research Foundation, the Environmental Finance Center has created the 2012 Texas Municipal Water and Wastewater Rates Dashboard, representing 702 municipal water and/or wastewater utilities in the Lone Star State.

Images courtesy of: https://commons.wikimedia.org/wiki/File:Texas_flag_map.svg and https://www.koraorganics.com/blog/wp-content/uploads/2011/11/water1.jpg.
But the Texas dashboard is not itself a lone star, in fact: this dashboard is one of several that the EFC at UNC will build for the Smart Management for Small Water Systems project. And this dashboard builds upon our years of experience in developing rates dashboards of various kinds, such as the recent 2012 Georgia Stormwater Utility Dashboard and 2012 Georgia Water and Wastewater Rates Dashboard. As our colleague, Matt Harris, put it when the latter of these Georgia rates analysis tools was released:
At the Environmental Finance Center at UNC-Chapel Hill our rates dashboards are… created to guide the drivers of rates. In a complex economy, prices need to be set efficiently and realistically or they don’t reflect the reality of the world in which people live. If rates are set too high in a community where wages are low, the issue of affordability is magnified. If rates are too low but water is scarce, a realistic need to conserve is going un-signaled to consumers that derive information on water scarcity from its price. Finally, and perhaps most importantly to the drivers of rates, if the price of water is too low the cost of driving the utility could go unrecovered.
Thus, to assist municipal water and wastewater utility owners and operators in the Lone Star State, as well as policymakers, journalists, researchers, and citizens, in obtaining the information they need from a number of different contexts to help set rates that promote financial stability, customer affordability, and conservation of scarce water resources, we have developed the Texas dashboard, a powerful benchmarking and analytical tool. The dials and progress bars on the Rates Comparison tab of the dashboard allow the user to select a service (water, wastewater, or both), as well as monthly usage (5,000 or 10,000 gallons of residential usage, or 50,000 or 200,000 gallons of commercial usage) and then to examine:
– Bill Comparison: How does the chosen bill compare to others in the selected comparison group?
– Cost Recovery: Is the utility’s long-term indebtedness (if any) being serviced in a financially sustainable way?
– Conservation Signal: How strong or weak a price signal is being sent to residential customers at higher ranges of use (the price increase from 5,000 to 10,000 gallons per month)?
– Affordability: For a chosen residential bill, what percentage of median household income (MHI) does it represent? (See more on the MHI indicator in this recent blog post.)
– Average Household Water Use: How many gallons per month of drinking water does the average household use in the utility’s service area?
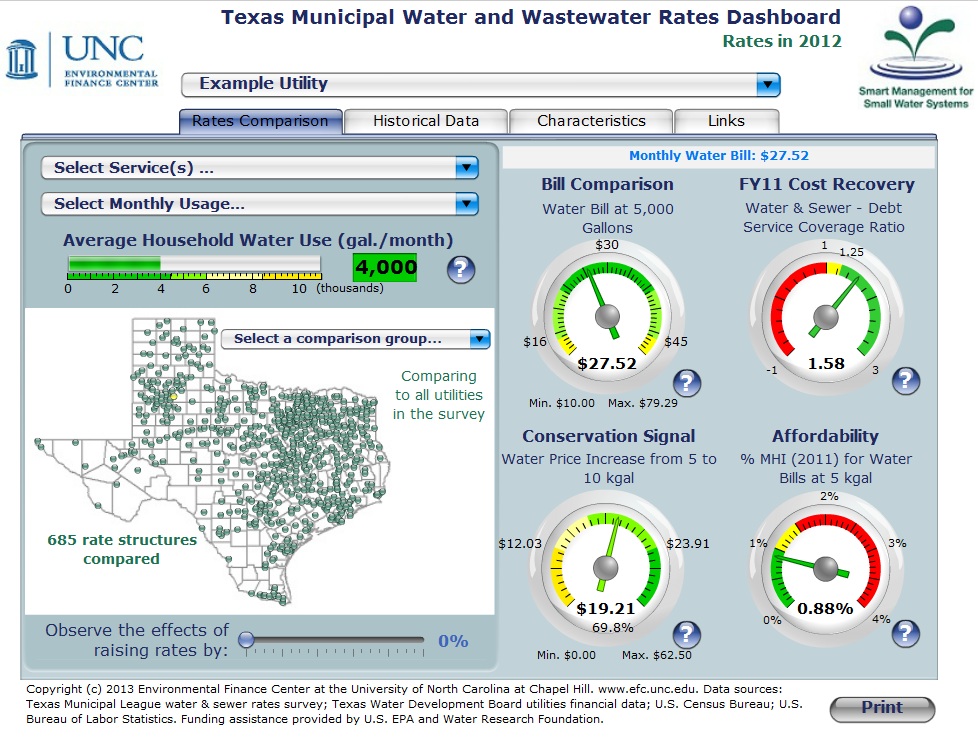
The Texas dashboard also empowers the user to control which comparison group (All Utilities, Similar Population, Similar Revenue Generation, Similar Household Income, Similar Residential Water Use, or Within 50 Miles Distance) is selected before examining the various data displays mentioned above since peer groups can help provide more appropriate analysis than 1-to-1 utility comparisons. And the new Historical Data tab allows the user to look at each utility for trends and patterns across time by viewing up to 11 years of annual data for:
– Residential Monthly Bills for 5,000 gallons per month
– Residential Monthly Bills for 10,000 gallons per month
– Average Household Water Use in gallons per month
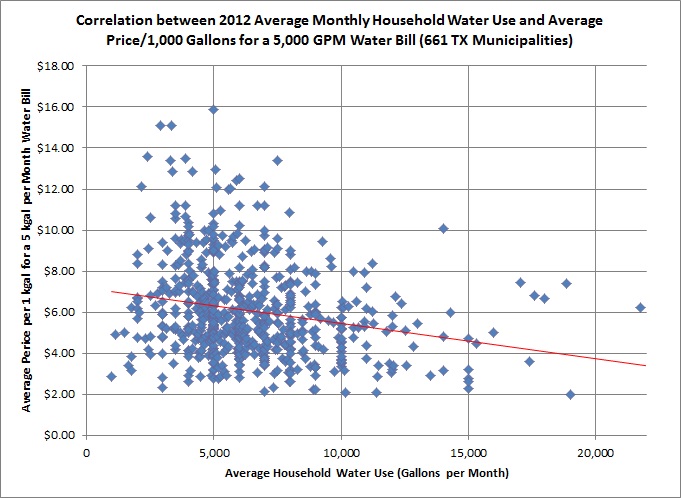
And the data behind the dashboard also allows us to conduct customized analyses upon request of individual utilities, such as this scatter plot showing how average household water use tends to decrease as the average price per thousand gallons per month increases:
So if you are a Lone Star small system (10,000 or fewer customers) water or wastewater utility in Texas, and would like some assistance with looking more closely at your balance of rates, financial sustainability, affordability, and conservation concerns, please feel free to contact us. We will be glad to help!