
The dynamic between public and private systems has always been interesting, especially in the case of water and wastewater systems. Public water systems are usually non-profit entities managed by local or state governments, for which rates are set by a governing board. On the other hand, private water systems can be for-profit systems managed by investors or shareholders. Though rates are monitored by a state’s public commission, private systems are not necessarily subject to this regulating board. Additionally, the difference between public and private is not always distinct, as we sometimes see in Public-Private Partnerships. In this post, we present some interesting facts and figures based on an analysis of national data on ownership of water utilities.
The Safe Drinking Information System, or SDWIS for short, contains information on water utilities and systems located in the United States and incorporated territories. The database contains statistics on drinking water violations and associated enforcement history that reaches as far back as 1993. The EPA created SDWIS to keep track of drinking water information in accordance with the Safe Drinking Water Act of 1974, which implements technical and financial programs in order to protect public drinking water.
The EPA, which created SDWIS, offers a variety of search tools to browse information held within its database. There are two main search options:
- The first, a simple Geography Search allows you to select a state or territory and search public water systems by county, city, or population. This straightforward method is helpful if you are looking for some quick, hard-hitting stats.
- The second search method available for public use is the Advanced Search Option. As suggested by its name, this search allows you to delve into more detail, including geographic region, ownership type, population, and a variety of other water system characteristics.
In compiling state by state water system stats, I began to notice that not only do public water systems outnumber private systems in most states, but they also serve an overwhelming majority of a state’s population compared to private systems. I chose to focus on data for Community Water Systems, or systems that supply water to the same population year-round, and therefore data is solely representative of these systems. Other water systems such as Non-Transient Non-Community Water Systems and Transient Non-Community Water Systems were not included in my analysis because these systems usually provide water services for half a year or less; these systems may or may not be relevant for your own search!
Here are a few interesting facts and figures:
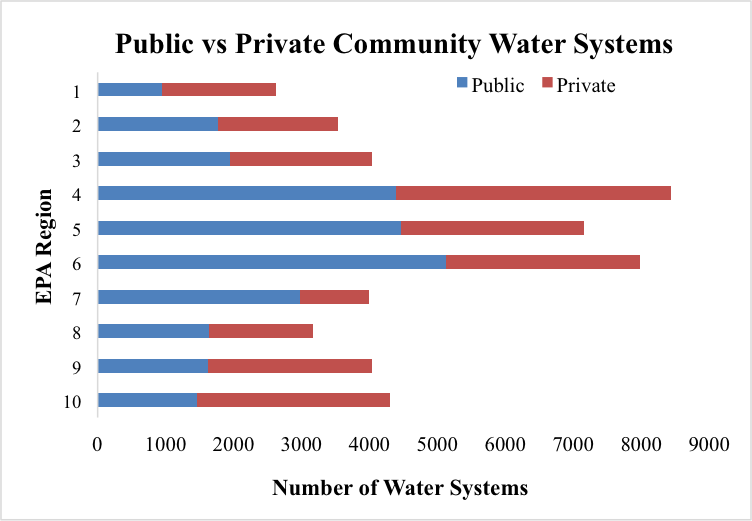
- 33 of 52 states and territories (including the District of Columbia and Puerto Rico) have more public than private water systems
- 50 of 52 states and territories (including the District of Columbia and Puerto Rico) have a larger portion of their population served by public than private water systems
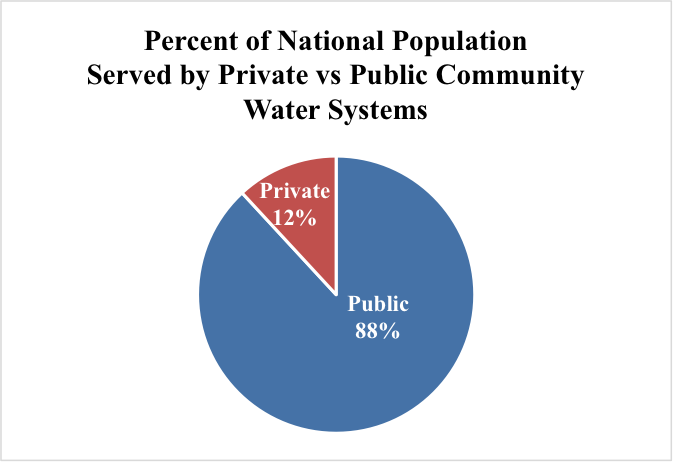
Efficiency, cost, and profit margins are all matters of debate, and it is difficult to say which type of ownership—public or private—is necessarily more beneficial to the customer. Although the figures above show that public water systems outnumber private systems overall, this fact does not diminish the important role of private water systems, which serve over 36 million people in the United States. Regardless of public or private ownership, I think we can all agree that the most important thing about water systems is that they provide access to safe, affordable, reliable drinking water for all.
*EPA Regions: 1) Connecticut, Massachusetts, Maine, New Hampshire, Rhode Island, Vermont; 2) New Jersey, New York, Puerto Rico, US Virgin Islands; 3) Delaware, District of Columbia, Maryland, Pennsylvania, Virginia, West Virginia; 4) Alabama, Florida, Georgia, Kentucky, Mississippi, North Carolina, South Carolina, Tennessee; 5) Illinois, Indiana, Michigan, Minnesota, Ohio, Wisconsin; 6) Arkansas, Louisiana, New Mexico, Oklahoma, Texas; 7) Iowa, Kansas, Missouri, Nebraska; 8) Colorado, Montana, North Dakota, Utah, Wyoming; 9) Arizona, California, Hawaii, Nevada, American Samoa, Guam; 10) Alaska, Idaho, Oregon, Washington
Featured image made by Flat Icon and author Roundicons. Licensed under Creative Commons BY 3.0.